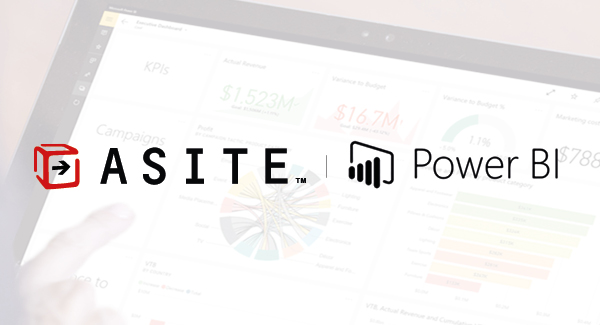
Power BI reports can now be embedded into the Asite platform dashboard, enabling fast and easy access to project data
London, United Kingdom (September 2020) – Asite is delighted to announce that Microsoft Power BI, the cloud-based business analytics service, has been integrated with the Asite platform.
Power BI reports can now be embedded into the Asite platform dashboard, enabling fast and easy access to user’s project data.
The new integration will allow Asite users to aggregate, analyze, visualize, and share their data on Asite via Power BI reports. The accessibility to this data will enable users to make more data-driven informed decisions.
As part of the integration, Asite users can customize Power BI report dashboards such as Common Data Environment, Defects, Health & Safety, and Project Financials dashboards for example.

Denis Antony, SVP Global Product Management for Asite, said:
“Asite’s integration with Microsoft Power BI is part of our strategic push to expand the Asite Partner Ecosystem and improve the Asite platform experience for all of our customers. Enterprise reporting can sometimes be a complex and time-consuming task, especially when you have vast amounts of data and not the right tools to analyze it.
Microsoft Power BI offers a collection of software services, apps, and connectors that work together to turn unrelated sources of data into coherent, visually immersive, and interactive insights. It provides users with the tools they need to enhance their reporting capabilities and offers a more streamline functionality to the reporting process
With our integration, users will be able to gain an enhanced view of their project portfolio through project reports that support fully interactive visuals and drill-downs, optimizing how they operate and enabling better collaboration and decision-making at all levels.”
Power BI’s cloud-based analytics service provides a 360º view of the business, enabling fast and easy access to data, data discovery and exploration, and collaboration across organizations by allowing anyone to visualize and analyze data.
Asite has created data connectors to extract and present Asite data in PowerBI. These reports can then be seamlessly embedded on users’ unique Asite dashboard, providing greater project visibility.
To ensure that Asite users get the most from the new integration, Asite has a built Power BI Report Templates, which are premade reports that can be personalized and redesigned to meet user needs.
With the help of these templates and data connectors, users can quickly roll out project reports on the Asite platform. These reports can be automatically refreshed up to eight times a day, ensuring users are working with the most accurate and up-to-date information. Reports can also be filtered by individual or multiple projects.
Asite users can initially choose from report dashboards providing insights into specific project information, such as:
Common Data Environment Dashboard
The powerful Common Data Environment (CDE) dashboard provides project teams with a portfolio view of all ongoing projects. It provides information on the status of project deliverables, a break-down of planned versus actual deliverables, key indicators, and S-Curves – a graphical report displaying the overall progress of a project. All information is represented in clear, accurate graphs.
The reports further list all document information and corresponding placeholders by the contractual deliverables and status.
Defects Dashboard
The Defects dashboard provides an overview of all site tasks (defects, snags, punch-lists, site inspections, etc.) across ongoing projects allowing users to understand how site tasks in the selected project are trending at configurable intervals.
In a few simple clicks, users can access the defect’s corresponding form through embedded hyperlinks, and update necessary values.
Health & Safety Dashboard
The Health and Safety dashboard provides project managers with overview of the hazards and incidents within their businesses, presenting critical information which enables Project Managers to make instant decisions and take corrective actions to prevent future hazards.
Project Financials Dashboard
The Project Financials dashboard provides project owners and contractors with clear visibility to project budget, estimated and actual costs, and scheduled information across a portfolio of projects. Portfolio Managers can track project financials for their projects in one, single location.
The dashboard enables integration with external ERP systems to have a single source of truth for all viewers, and provides access to detailed project cost sheets and schedules to monitor progress and critical path, enabling users to make informed decisions.
About Asite
Asite’s vision is to connect people and help the world build better.
Asite’s open construction platform enables organizations working on capital projects to come together, plan, design, and build with seamless information sharing across the entire supply chain.
Asite’s comprehensive range of solutions connect dispersed teams across the lifecycle of capital assets, enabling them to build better and build resilience. With Asite, capital project owners stay at the forefront of innovation, maintaining a golden thread of information throughout a project to facilitate the creation of digital twins.
Asite is headquartered in London's Tech City with regional offices in New York, Houston, Dubai, Riyadh, Sydney, Hong Kong, and Ahmedabad.
For more information about Asite, please contact sales@asite.com
About Microsoft Power BI
Power BI is a cloud-based business analytics service by Microsoft. It offers a collection of software services, apps, and connectors that work together to turn your unrelated sources of data into coherent, visually immersive, and interactive insights.
Power BI aims to provide interactive visualizations and business intelligence capabilities with an interface simple enough for end-users to create their own reports and dashboards.
This data may be an Excel spreadsheet or a collection of cloud-based and on-premises hybrid data warehouses. Power BI lets its users easily connect to its data sources, visualize and discover what's important, and share that with anyone or everyone they want.